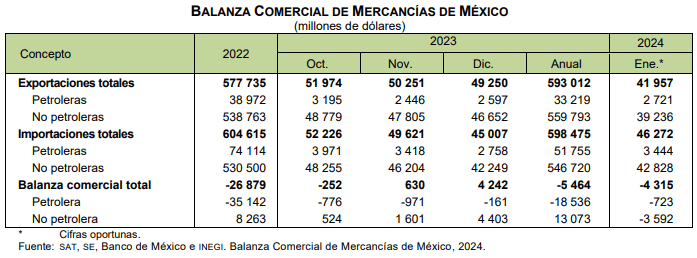
Mexican merchandise imports fell 1% in January 2024, to 46.272 billion dollars, Inegi informed this Tuesday.
Among the products that Mexico imports the most are auto parts, gasoline, advanced electronic circuits, gas, telephones, computers and cars.
To ponder: considering full years, Mexican merchandise imports decreased in 2019 and 2020, respectively 1.9% and 15.8%; then, in 2021 and 2022, they grew 32.1% and 19.6%, in that order, and finally they went back 1% in 2023.

What are the main origins of these purchases? The United States, China, South Korea, Germany, Japan, Taiwan and Malaysia.
In a first subdivision, imports of petroleum products to Mexico amounted to 3.444 billion dollars last January, which is 38% less at a year-on-year rate.
On the other hand, non-oil foreign purchases increased 4% at an annual rate, to 42.828 billion dollars.
In a second subdivision, imports of consumer goods rose 1.5% in January, to 7.145 billion dollars.
Meanwhile, imports of intermediate goods totaled 34.123 billion dollars, 4% less than in January 2023.
Finally, imports of capital goods grew 21.6%, to 5.004 billion dollars.
Mexican merchandise imports
The Mexican economy is dependent on foreign trade with other economies, specifically the United States and certain Latin American countries.
Mexico is an emerging market and demonstrates significantly greater volatility from time to time compared to developed markets.
Among other things, the country is dependent on the U.S. economy and any change in the price or demand for Mexican exports can have an adverse impact on the Mexican economy.
Recent political developments in the United States have raised potential implications for current U.S.-Mexico trade agreements.
With seasonally adjusted data, total foreign purchases registered a monthly increase of 1.47% in January, which originated from increases of 0.46% in non-oil imports and 16.53% in oil imports.
By type of good, there were monthly increases of 3.29% in imports of consumer goods, 0.86% in those of intermediate use goods and 3.31% in those of capital goods.

